

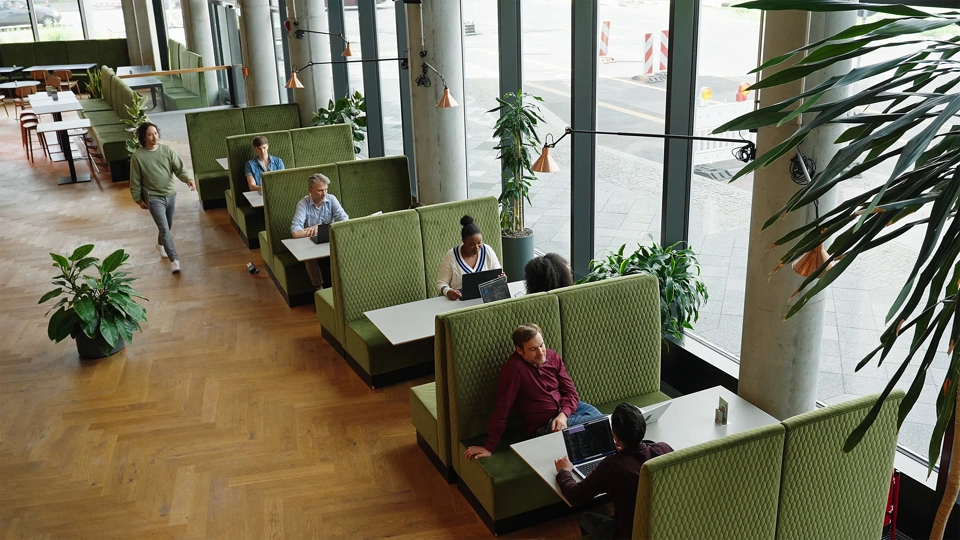

Our guide includes fit-out cost trends across 58 global office markets—helping you make smarter capital planning decisions, manage risk, and improve delivery certainty.
Our 2026 office cost fit-out guide
As workplace expectations continue to rise, fit-out costs are increasing, too. The office has evolved into a strategic asset—not just an operational one. Decisions made at the concept stage now have an outsized impact on capital cost, schedule certainty, and long-term operational performance.
Our Global office fit-out cost guide 2026 provides a clear view of office fit-out costs across the world—supporting corporate occupiers as they make critical real estate decisions in an increasingly competitive and complex market.
The guide helps organizations plan capital more effectively, benchmark costs globally, and align workplace investment with broader business goals.
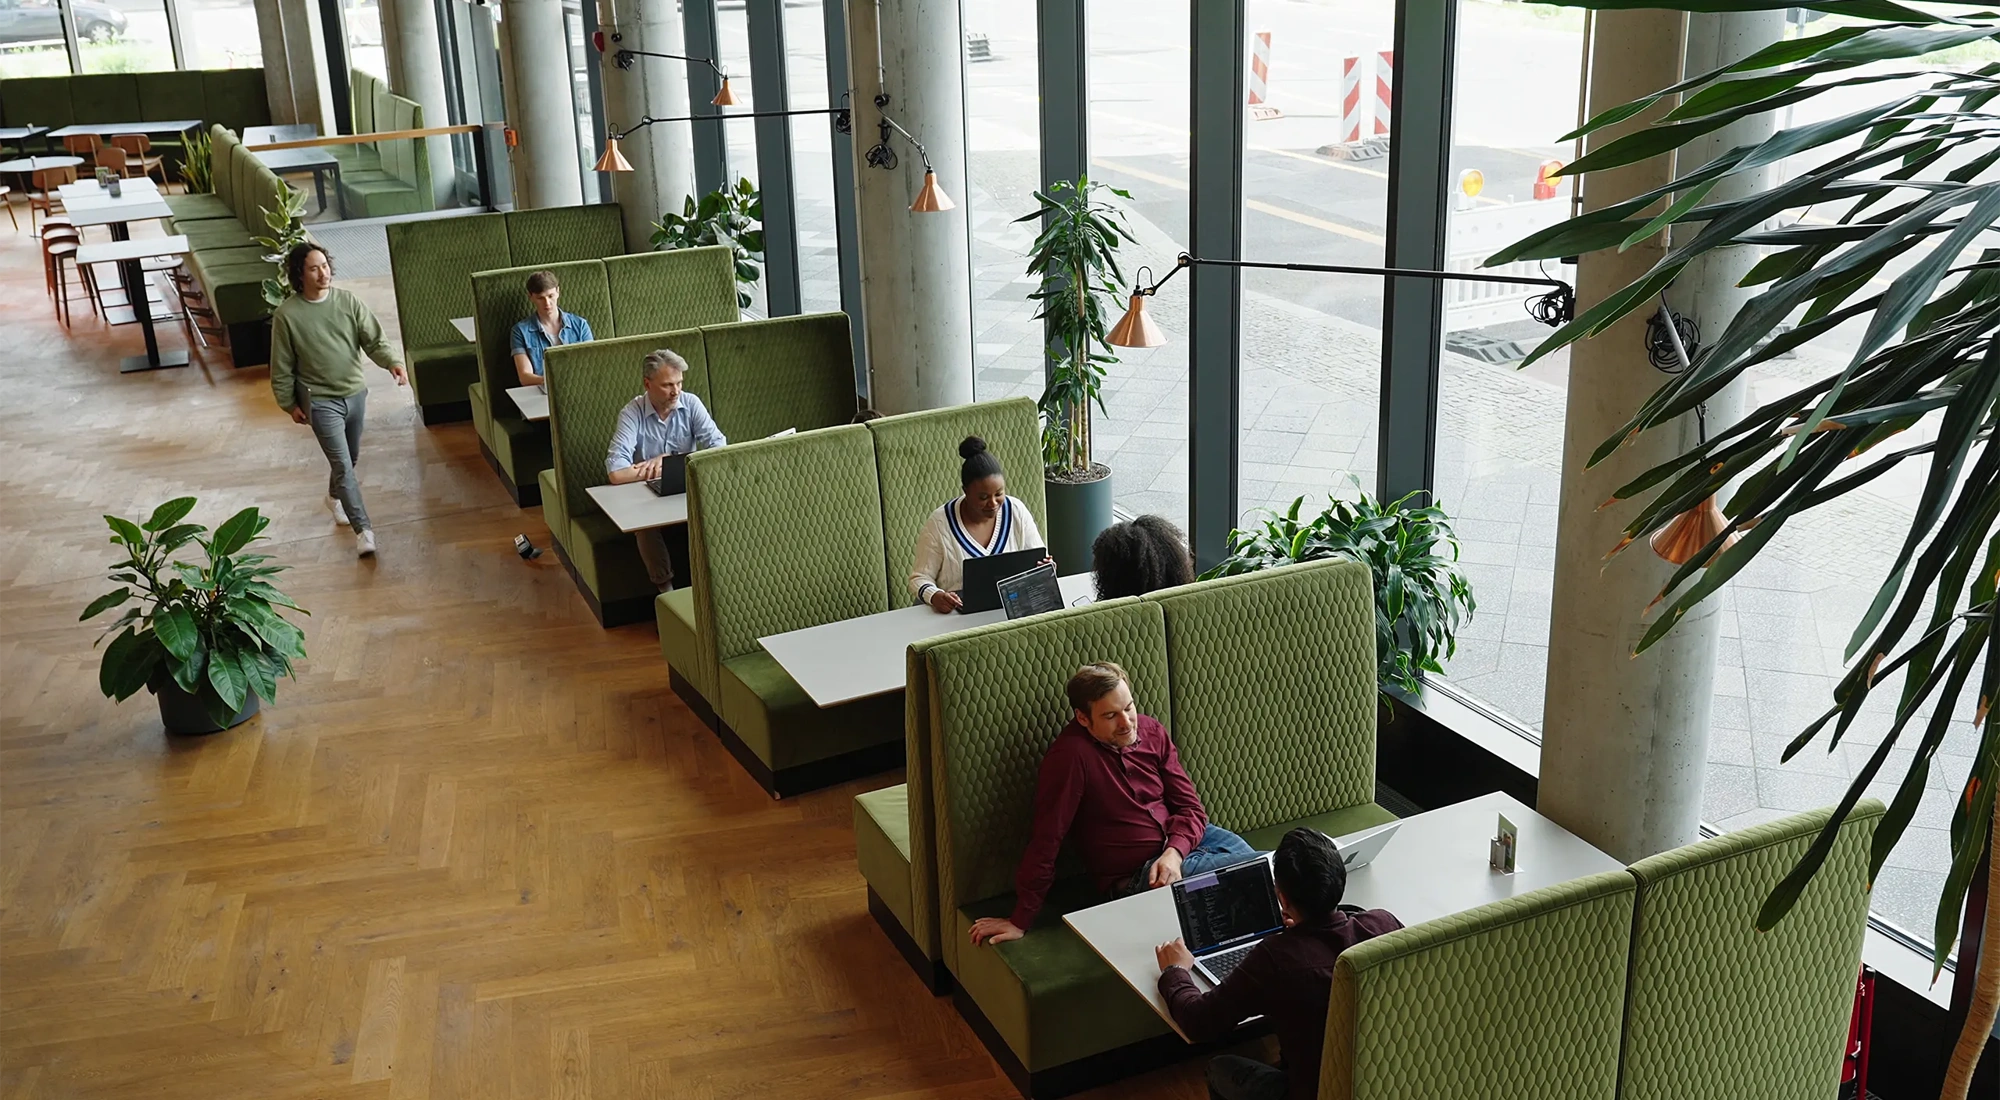
Occupiers are raising the bar on quality
Across all regions, strong competition for talent in all key industries is driving more spending than ever on high-quality fit-outs.
Offices are moving up the value chain
Strong competition for talent in industries like finance and tech is fueling increased investment in higher-quality fit-outs, with high-specification fit-outs seeing the steepest year-over-year cost increases.
Clients are investing in high impact areas
While cost pressures are pushing clients to find savings, many continue to prioritize targeted investments in functional zones that drive productivity, well-being, and connection in the office. These include collaboration areas, cafés and dining spaces, and tech-enabled meeting rooms—which come at a higher price tag, as shown in our spotlight city functional zone data.
Premium markets command premium prices
For the global top six markets, costs average more than $5,000 per m2 for high-specification fit-outs (using a constant currency comparison).
HQs are the primary focus
Clients are increasingly prioritizing investment in flagship spaces in major cities worldwide, reversing the early-2020s trend toward a “hub and spoke” approach. This shift comes as major cities face acute shortages of premium Grade A space, due to a slowdown in development pipelines earlier in the decade. As a result, stay vs. go decisions are becoming tougher and more complex than ever.
What’s inside the guide?
- The guide analyzes 58 office markets globally, presenting CAT A and CAT B fit-out costs across high, medium, and low specification levels.
- Seventeen spotlight cities are explored in greater depth, providing functional zone pricing and highlighting local drivers, market dynamics, and emerging workplace trends.
- Analysis of commercial drivers that matter in 2026, including flight to quality, stay vs. go decisions, and the impact of AI.
Whether you’re planning a single office project or managing a global portfolio, the guide provides the insight needed to compare costs, assess risks, and make informed investment decisions.
Explore our flagship, data-led market intelligence reports








Get our latest insights direct to your inbox
Sign up for our newsletter - trends, market intelligence and expert perspectives.
Get our latest insights direct to your inbox
Sign up for our newsletter - trends, market intelligence and expert perspectives.